
Gaming Chair Industry Statistics 2026

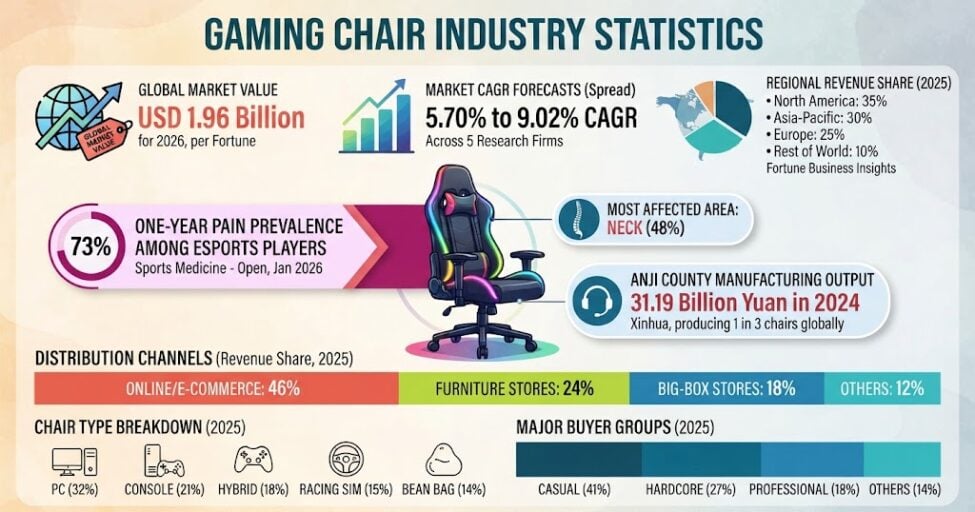
This post lays out their published numbers, the segment splits behind them, and the health and manufacturing data underneath.
Gaming Chair Industry Statistics
How Big Is the Gaming Chair Industry?
Five firms publish a global revenue estimate for gaming chairs. Each uses its own scope definition, base year and forecast window, so the rows below are separate estimates rather than one measured market.
The base-year values cluster between USD 1.53 billion and USD 1.96 billion. The forecasts do not: Fortune’s 2034 figure is USD 1.21 billion above IMARC’s for the same year.
| Research firm | Base-year value | Forecast value | CAGR (period) |
|---|---|---|---|
| Fortune Business Insights | USD 1.96 bn (2026) | USD 3.91 bn (2034) | 9.02% (2026–2034) |
| Coherent Market Insights | USD 1.76 bn (2026) | USD 2.99 bn (2033) | 7.9% (2026–2033) |
| SkyQuest | USD 1.53 bn (2025) | USD 2.80 bn (2033) | 7.8% (2026–2033) |
| Market.us | USD 1.7 bn (2024) | USD 3.4 bn (2034) | 7.2% (2025–2034) |
| IMARC Group | USD 1.6 bn (2025) | USD 2.7 bn (2034) | 5.70% (2026–2034) |
Source: Fortune Business Insights, updated August 2026; Coherent Market Insights, March 2026; SkyQuest; Market.us, February 2025; IMARC Group. Each figure is that firm’s own estimate of global gaming chair revenue.
Three of the five CAGRs land between 7.2% and 7.9%. IMARC sits lowest at 5.70% and Fortune highest at 9.02%. Broader platform spending is tracked separately in these gaming industry revenue statistics.
Gaming Chair Industry Market Share By Region
Fortune Business Insights splits 2025 revenue across four regions that total 100%. North America leads at 35%.
| Region | Share of gaming chair revenue |
|---|---|
| North America | 35% |
| Asia-Pacific | 30% |
| Europe | 25% |
| Rest of World | 10% |
Source: Fortune Business Insights, Gaming Chair Market, 2025 shares.
Coherent Market Insights reads the same regions differently. Under its scope, Asia Pacific takes 47.8% of 2026 revenue and North America is the fastest-growing region. The two splits are not comparable: they use different base years and different scope definitions.
Market.us puts a dollar value on North America. It reports 34.6% of the 2024 market, worth USD 0.59 billion. Fortune’s 35% and Market.us’s 34.6% are close, but they describe different years.
Gaming Chair Industry Segments By Chair Type
PC gaming chairs lead Fortune’s type breakdown at 32%. The five categories total 100%.
| Chair type | Share of gaming chair revenue |
|---|---|
| PC gaming chair | 32% |
| Console gaming chair | 21% |
| Hybrid gaming chair | 18% |
| Racing simulator chair | 15% |
| Gaming bean bag chair | 14% |
Source: Fortune Business Insights, Gaming Chair Market, 2025 shares.
Market.us cuts the category by silhouette instead of platform. It reports racing style chairs at 42.3% in 2024, its leading type segment. That is a different taxonomy, not a contradiction of Fortune’s PC figure, which tracks the desktop base sized in these PC gaming market statistics.
Coherent Market Insights uses a third set of labels and puts its table gaming segment at 41.6% for 2026. Some of that seated time is moving to portable hardware, as the Steam Deck adoption figures show.
Which Gamers Buy Gaming Chairs?
Fortune splits buyers into four groups. Casual gamers are the largest at 41%.
| Type of gamer | Share of gaming chair revenue |
|---|---|
| Casual gamers | 41% |
| Hardcore gamers | 27% |
| Professional gamers | 18% |
| Others (creators, streamers, remote workers) | 14% |
Source: Fortune Business Insights, Gaming Chair Market, 2025 shares.
Market.us reaches a different result on a different segmentation, reporting professional gamers at 50.4% of its 2024 end-user segment. The two cannot be averaged, and neither counts people, as the wider video game player data does.
Where Gaming Chairs Are Sold
Online and e-commerce channels take 46% of Fortune’s 2025 distribution split. Three offline channels account for the remaining 54%.
| Distribution channel | Share of gaming chair revenue |
|---|---|
| Online / e-commerce | 46% |
| Office supply and furniture stores | 24% |
| Hypermarkets and big-box stores | 18% |
| Others (gaming cafes, showrooms) | 12% |
Source: Fortune Business Insights, Gaming Chair Market, 2025 shares.
Coherent Market Insights puts the online segment higher, at 52.6% of the 2026 market, and its residential end-user segment at 59.7%. Both firms agree offline retail still moves a large share of units.
Gaming Chair Industry Demand and Esports Pain Prevalence
A systematic review published in Sports Medicine – Open on 3 January 2026 pooled six studies covering 553 participants, drawn from 13 that met the inclusion criteria. It found a 73% one-year pain prevalence among esports players and 44% over seven days.
Most of the included studies used cross-sectional surveys, and eight of the thirteen relied on unvalidated questionnaires. The authors flag heterogeneity as a limit on how far the pooled rates travel.
| Body region | One-year prevalence | Seven-day prevalence |
|---|---|---|
| Any pain | 73% | 44% |
| Spine | 41% | 19% |
| Upper extremities | 31% | 14% |
| Hand / wrist / fingers | 37% | 20% |
| Lower extremities | 12% | 5% |
Source: Soffner et al., Sports Medicine – Open, volume 12, article 1, published 3 January 2026. Pooled random-effects prevalence rates.
Within the one-year window, neck pain reached 48% and shoulder pain 37%. Over seven days, the lower back was the most affected single area at 22%, just ahead of hand, wrist and fingers at 20%. Seated regions, not the wrist, carry the highest readings.
Gaming Chair Manufacturing in Anji, China
Xinhua reported in September 2025 that Anji county in Zhejiang produces one in every three chairs made in China, and half of the chairs China exports.
| Metric | 2024 figure |
|---|---|
| Green home industry output value | 39.11 billion yuan, up 7.7% year on year |
| Chair manufacturing output value | 31.19 billion yuan |
| Home furnishing export value | 22.37 billion yuan, 62.5% of county exports |
| Enterprises in the local industry | Over 1,700 |
Source: Xinhua, 8 September 2025, citing official data for 2024. Output value and export value are separate measures.
One local firm, Anji Wanbao Intelligent Home Technology, sold over USD 20 million of a single gaming chair model and ranked among top sellers in US and European markets, per the same report. Hardware replacement cycles for the rest of a desk setup follow different rhythms, covered in these gaming hardware upgrade statistics.
Gaming Chair Industry Brand Shares and Secretlab Revenue
Fortune names Secretlab at 18% and DXRacer at 15% of category share. ECDB tracks something narrower: e-commerce GMV on the domains it monitors.
| Metric | Figure | Measures |
|---|---|---|
| Secretlab category share | 18% | Share of gaming chair revenue, 2025 |
| DXRacer category share | 15% | Share of gaming chair revenue, 2025 |
| Secretlab annual revenue | US$43m | E-commerce GMV, 2025 |
| secretlab.eu revenue | US$37m | E-commerce GMV, 2025 |
| Growth 2024 to 2025 | 15–20% | Change in e-commerce GMV |
| Growth forecast 2026 | 0–5% | Forecast change in e-commerce GMV |
Source: Fortune Business Insights for category shares, 2025; ECDB for e-commerce GMV, 2025 and 2026 forecast. The two rows measure different things and are not comparable.
ECDB records Singapore as Secretlab’s main market at 14% of 2025 revenue, and 100% first-party sales. The forecast 0–5% growth for 2026 sits below every market CAGR in the first table, though those track a different denominator. Cross-device play patterns that shape desk time appear in these cross-platform gaming figures and in the cloud gaming market data.
FAQs
How big is the gaming chair industry?
Fortune Business Insights values it at USD 1.96 billion in 2026, reaching USD 3.91 billion by 2034. Coherent Market Insights gives USD 1.76 billion for 2026. IMARC Group puts 2025 at USD 1.6 billion.
Which region leads the gaming chair industry?
It depends on the firm. Fortune Business Insights gives North America 35% of 2025 revenue. Coherent Market Insights gives Asia Pacific 47.8% of 2026 revenue. The two use different scope definitions.
Do gaming chairs actually help back pain, as Reddit threads often debate?
Reddit discussions are anecdotal. The published evidence measures the problem, not the fix: Sports Medicine – Open reported 41% one-year spine pain prevalence among esports players in January 2026. No trial in that review tested chairs.
Is Secretlab as dominant as Reddit makes it look?
Reddit visibility is not market share. Fortune Business Insights puts Secretlab at 18% of category revenue and DXRacer at 15%. ECDB separately tracks US$43m in Secretlab e-commerce GMV for 2025.
What share of gaming chairs sell online?
Fortune Business Insights gives online and e-commerce 46% of 2025 revenue. Coherent Market Insights puts the online segment at 52.6% for 2026. Offline channels still account for a large share under both.
Sources
https://www.fortunebusinessinsights.com/gaming-chair-market-111916
https://www.coherentmarketinsights.com/market-insight/gaming-chair-market-5134
https://link.springer.com/article/10.1186/s40798-025-00971-1
https://english.news.cn/20250908/41978d7877df45d69a30b0090ed61b78/c.html
