Live Service vs Traditional Game Revenue Comparison [2026 Data]

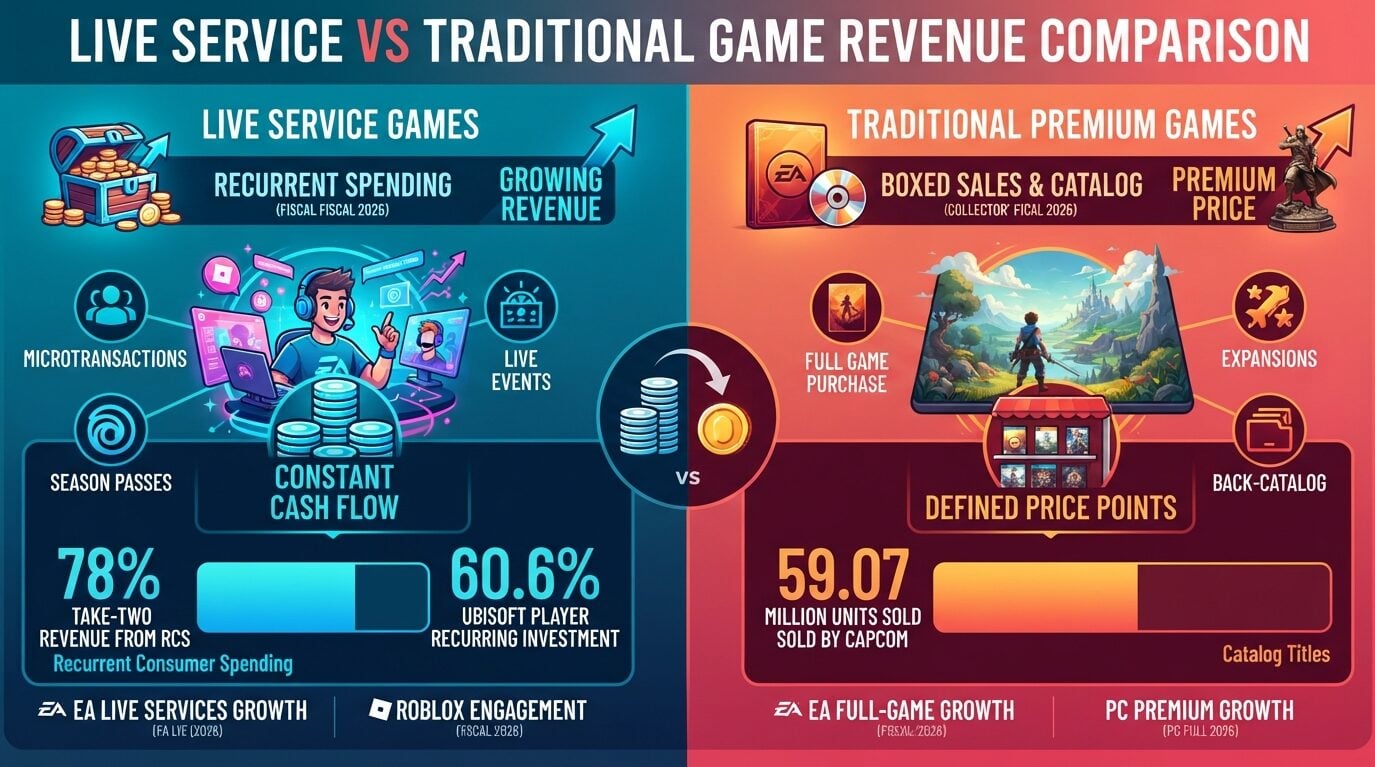
Take-Two drew 78% of its fiscal 2026 net bookings from recurrent consumer spending. Capcom, which sells mostly premium games, sold 59.07 million units in the same fiscal year, and 49.46 million were catalog titles. This comparison sets publisher filings beside Newzoo’s 2025 market data, U.S. spending figures and Sony’s Bungie write-down, using releases published through November 2026.
Live Service vs Traditional Game Revenue Comparison: 2026 Snapshot
Which Publishers Earn More From Live Services Than From New Games?
Each publisher reports recurring spending under its own label. The figures below keep those exact terms.
Electronic Arts
EA’s live services and other net bookings reached $5,630 million in the fiscal year ended March 31, 2026, up 5%. Full game net bookings rose 19% to $2,396 million, which EA tied mainly to the Battlefield 6 release.
| Category | FY2026 net bookings | YoY change |
|---|---|---|
| Live services and other | $5,630M | +5% |
| Full game | $2,396M | +19% |
| Total | $8,026M | +9% |
The quarter ended June 30, 2026 was EA’s last reported period as a listed company. Live services and other brought in $1,116 million (+3%), and full game added $233 million (+9%).
EA completed its take-private sale to PIF, Silver Lake and Affinity Partners on August 4, 2026, and its stock was delisted from Nasdaq.
Take-Two Interactive
| Period | Recurrent share of net bookings | Recurrent net bookings YoY |
|---|---|---|
| FY2026 (Apr 2025-Mar 2026) | 78% | +17% |
| Q4 FY2026 (Jan-Mar 2026) | 82% | +7% |
| Q1 FY2027 (Apr-Jun 2026) | 84% | -1% |
| Q2 FY2027 (Jul-Sep 2026) | 81% | -9% |
Take-Two defines recurrent consumer spending as virtual currency, add-on content, in-game purchases and in-game advertising. Total fiscal 2026 net bookings were $6.72 billion, up 19%.
The share stayed above 80% in the September 2026 quarter even as the category shrank. Full-game and other bookings fell to $299.2 million from $532.2 million in that quarter.
For fiscal 2027, Take-Two projects flat recurrent spending and net bookings of $8.0 billion to $8.2 billion. Grand Theft Auto VI is set for November 19, 2026.
Ubisoft
Ubisoft’s player recurring investment (PRI) rose 14.7% to EUR 924.7 million in fiscal 2025-26. Total net bookings fell 17.4% to EUR 1,525.1 million over the same year, lifting PRI’s share to 60.6% from 43.7%.
Back-catalog net bookings held at EUR 1,281.8 million (-1.1%). Ubisoft posted a non-IFRS operating loss of EUR 1,044.7 million for the year.
In the quarter ended June 30, 2026, PRI totaled EUR 151.3 million (-0.4%), or 59.1% of net bookings.
Premium Spending Grew 25.3% on PC: Newzoo’s Live Service vs Traditional Revenue Split
| Segment | 2025 revenue | YoY change |
|---|---|---|
| Global games market | $201.6B | +9.1% |
| Mobile | $113.3B | +10.7% |
| Console | $44.7B | +2.8% |
| PC | $43.6B | +12.0% |
Business models split sharply on console. Full-game spending rose 8.1% to $19.9 billion, while microtransactions fell 4.6% to $13.3 billion.
PC moved differently. Premium game spending grew 25.3% to $14.1 billion, and microtransactions rose 9.1% to $20.3 billion, or 47% of PC revenue.
Newzoo does not split mobile revenue by model in this release. Platform and audience figures from earlier years sit in our video game industry statistics.
Price Tiers in Six Western Markets
Newzoo’s PC & Console Gaming Report 2026 measures revenue in the US, UK, Germany, France, Spain and Italy. In 2025, PC buy-to-play sales rose 17.4%, while F2P revenue fell 8.2% on PlayStation and 23.6% on Xbox.
The 30-50 tier grew 60% on PC, 99% on PlayStation and 45% on Xbox. Titles above $50 grew 58% on PC and 34% on PlayStation, with Battlefield 6 alone taking 3.9% of 2025 PC revenue in those markets.
Sub-$30 new releases took 9% of PC revenue, led by Schedule I at 1.6%. Storefront data for that segment is in our Epic Games Store vs Steam share breakdown.
Is Free-to-Play Losing Ground? Playtime and Concentration Data
Free-to-play titles took 29.3% of 2025 playtime across PC, PlayStation and Xbox, down 2.9 points from 2021. Total F2P time held near 30 billion hours, based on Newzoo engagement data for 37 markets excluding China and India.
Roblox, which Newzoo counts separately, rose from 3.3% to 7.9% of playtime over the same span. Fortnite playtime fell 29% in 2025 and Call of Duty fell 33%.
New F2P live-service launches averaged 14.7 a year in 2023-2025, against 21.3 in 2020-2022. The top five titles’ share of console F2P revenue eased from 79% in 2021 to 72% in 2025.
Revenue stays top-heavy. The top 20 titles earned more than 60% of 2025 console revenue and 44% on PC in Newzoo’s six-market data, while new releases held 12-13% of playtime for three straight years.
Roblox in Q3 2026
Roblox bookings fell 12% to $1.697 billion in the quarter ended September 30, 2026. Revenue rose 16% to $1.572 billion over the same period, and daily active users averaged 138 million, down 9%.
Average monthly unique payers dropped 16% to 30.3 million. Roblox guided fourth-quarter 2026 bookings to $1.89 billion to $2.0 billion, a 10% to 15% decline.
Traditional Game Revenue at Capcom: 59.07 Million Units, Mostly Catalog
| Period | Total units sold | Catalog units sold |
|---|---|---|
| FY ended March 2025 | 51.87M | 39.49M |
| FY ended March 2026 | 59.07M | 49.46M |
| H1 FY2027 (Apr-Sep 2026) | 36.86M | 32.18M |
Capcom reported net sales of JPY 195,365 million (+15.2%) and operating profit of JPY 75,295 million (+14.5%) for the year ended March 31, 2026. Resident Evil Requiem sold 6.91 million units between its February 2026 launch and March 31.
First-half units for April to September 2026 rose to 36.86 million from 23.85 million a year earlier. Capcom kept its full-year plan of JPY 210 billion in net sales and JPY 83 billion in operating profit.
What Did Sony’s Bungie Write-Down Cost?
Sony recorded impairment losses of JPY 31.5 billion in the second quarter and JPY 88.6 billion in the fourth quarter of fiscal 2025 against Bungie’s intangible and other assets. The full-year total reached JPY 120.1 billion for the year ended March 31, 2026.
Sony linked the second-quarter charge to Destiny 2’s underperformance. The fourth-quarter charge came in the quarter Marathon launched. Sony bought Bungie for $3.6 billion in 2022.
U.S. Live Service vs Traditional Game Spending: Subscriptions Up, Discs Down
| Category | 2025 U.S. consumer spending (final) |
|---|---|
| Content | $52.4B |
| Hardware | $5.4B |
| Accessories | $2.9B |
| Total | $60.8B |
The first release, on February 11, 2026, put 2025 spending at $60.7 billion, up 1.4%. A March 2026 restatement by Circana and Sensor Tower set the final total at $60.8 billion.
Subscription services rose 20% in 2025, per the original release. Game Pass access rules are covered in our Xbox Cloud Gaming vs local play statistics.
Mobile game spending reached $26.7 billion, according to Sensor Tower. Apple’s own game subscription is tracked in our Apple Arcade subscriber data.
New physical game sales fell 11% to about $1.5 billion, the lowest in Circana’s tracking since 1995, according to Circana analyst Mat Piscatella. Used hardware pricing sits in our second-hand vs new console sales comparison.
Circana projects U.S. spending of $62.8 billion in 2026, a 3% rise.
FAQs
Do live service games make more money than premium games?
Not across the board. Take-Two earned 78% of fiscal 2026 net bookings from recurrent spending, yet Capcom posted JPY 75,295 million in operating profit that same fiscal year selling mostly premium catalog titles.
How much of Take-Two’s revenue comes from live services?
Recurrent consumer spending made up 78% of Take-Two’s $6.72 billion net bookings in the fiscal year ended March 2026. In the September 2026 quarter the share was 81%, though the category fell 9%.
Are microtransactions declining?
On console, yes. Newzoo reported console microtransaction revenue fell 4.6% to $13.3 billion in 2025, while PC microtransactions rose 9.1% to $20.3 billion.
How much did Sony lose on Bungie?
Sony booked JPY 120.1 billion in impairment losses on Bungie’s intangible and other assets in fiscal 2025, which ended March 31, 2026: JPY 31.5 billion in Q2 and JPY 88.6 billion in Q4.
Is Reddit right that live service games are dying?
The data is mixed. Newzoo put F2P at 29.3% of 2025 PC and console playtime, down 2.9 points from 2021, but Take-Two still drew 78% of fiscal 2026 net bookings from recurrent spending.
Sources
https://www.sec.gov/Archives/edgar/data/0000712515/000162828026033617/ea-20260331.htm
